Understanding Google Analytics 4 Reporting
Google Analytics 4 is bringing a new, forward-thinking approach to collecting data. User privacy is increasingly important, and tracking user behavior across the web has become a challenge for digital marketers and website owners. That’s why GA4 was made with the intent to simplify reporting. GA4 reporting uses advanced machine learning to create a single-user story that can be interpreted by digital marketers and website owners alike. The platform includes an easy-to-read dashboard, pre-built reports and custom reporting capabilities so you can view the data you care about most.
Our digital marketing experts at Blue Compass have spent time learning about GA4 and monitoring any changes and updates that have taken place over the course of the year thus far. We want to help you feel prepared for the official transition to GA4 in July of next year by sharing our expert insights and tips for using and understanding GA4 reports.
What Are Standard Reports In Google Analytics 4?
Standard GA4 reports are the pre-built reports that live within the left-hand navigation. These reports deliver data in summary cards that are visually appealing and can be used to discover user trends or discrepancies quickly. While both UA and GA4 provide easily digestible data, GA4 reporting has a much cleaner look, default report customizations and a better custom report visualization builder. Standard GA4 reports can be used as a basis for creating custom reports that instead use the GA4 dimensions and metrics you choose.
GA4 standard reports are broken out into 3 collections:
- Life cycle collection - data is organized and displayed by the stages of a customer’s journey – acquisition, engagement, monetization and retention.
- User collection - these reports can be used to gain insights on the type of users who are visiting your website. It includes demographic data and tech data.
- App developer collection - This only applies to websites with connected apps. This collection provides information about your connected apps and how they’re being used.
Life Cycle Collection In GA4
The life cycle collection in Google Analytics 4 is made up of four different reports. Together, the data collected in Life Cycle reports tell the story of a customer’s journey with your website.
Acquisition GA4 Report
The Acquisition reports show you where new and returning users are coming from. This is one of the most valuable pieces of data GA4 offers. By understanding how users arrive at your website, you can create better marketing campaigns in the future and better understand what your current efforts are or aren’t working. The acquisition report can even be customized to compare the data you care about most, all in just a button click.
Engagement GA4 Report
Google Analytics 4’s engagement report is a very welcoming addition for digital marketers. There hasn’t been a standard way to measure engagement for a long time. Analysts would instead use metrics like bounce rate to create their calculations for engagement. With this new, standard engagement report, you can measure how users engage with your website based on the events and conversion events that users trigger and the web pages and app screens they visit.
Monetization GA4 Report
Monetization in GA4 only shows data for websites that track revenue-based events like ecommerce and in-app purchases. You will not see any data in this report until those events are set up. The monetization report in GA4 provides an easy way to view details about the money you’re generating and the revenue sources it's coming from. It’s a great way to identify user trends over time and determine the efficacy of your campaigns. Additionally, it is a large report with many customizable elements that allow you to monitor any revenue you wish.
Retention GA4 Report
Retention in GA4 reports shows the percentage of users who return each day in the first 42 days after their first visit to your website. It can help you determine your most valuable users based on the events they trigger after that initial visit. These reports tell a story about how long a user engages with your website or app. For example, you can look at user retention by cohort to see new users vs. returning users. This report section tells you which new users return to your website on their second and eighth days. This section of GA4 reports is a great place to go if you’re looking to narrow down your target audience to your most engaged and highest converting users.
User Collection In GA4
Google Analytics 4 includes a User Collection that is made up of two different reports – the Demographics report and the Tech report. Data within this collection helps you gain insights on the type of users who are visiting your website so that you can better cater information about your business to them.
Demographics GA4 Report
It’s one thing to know what users are doing on your website, but to fully understand your target audience, you have to know who those users are. The demographics report in GA4 shows information about users who visit your websites such as their average age, country, city, language, interests and gender. This information can then be used to hone in on your target audience and better tailor your marketing efforts toward them. However, before you can see this data, you must go to your property settings and enable Google Signals. This can be found by going to the admin panel > data settings > data collection. Here, you can enable Google signals data collection with the Get Started button.

Tech GA4 Report
This report displays information about the device users are using to get to and engage with your website. Device categories are split between mobile devices, desktop and tablets. The tech reports section also shows which method users use to access your content. For example, users could be visiting your website from a web browser, iOS app or Android app. You can use the data collected in tech reports to understand better how users view your website's content and then optimize that content or plan future implementations to better fit user preferences.
App Developer Collection In GA4
There are two types of reports that live within the App Developer Collection in Google Analytics 4. They are the Games reports and the Firebase reports, both of which only apply to websites with connected apps. You can use this collection to find information about your connected apps and how they’re being used.
Games GA4 Report
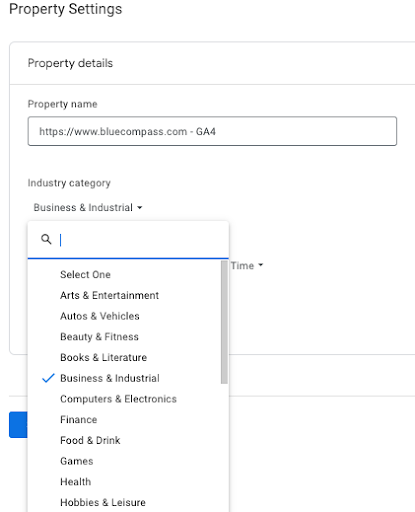
The game's topic in Google Analytics 4 reporting is designed for properties that use a mobile gaming app or have their industry category set to Games (pictured below). As you can probably guess, the games report shares data about how users are engaging with your mobile gaming apps. These reports are meant to replicate the player funnel and help you understand how you acquire users, keep them coming back and generate revenue.

Firebase GA4 Report
Firebase is an application development software developers can use to create iOS, Android and Web apps. The Firedbas topic in GA4 reports summarizes key metrics about any apps you have that are connected to Firebase. Data includes information about users and their behavior as well. If you try to access the Firebase reports prior to setting up Google Analytics for Firebase SDK, you won’t be able to find it. However, once set up, you can easily locate this data in the left-hand navigation under App developer.
GA4’s Realtime Report
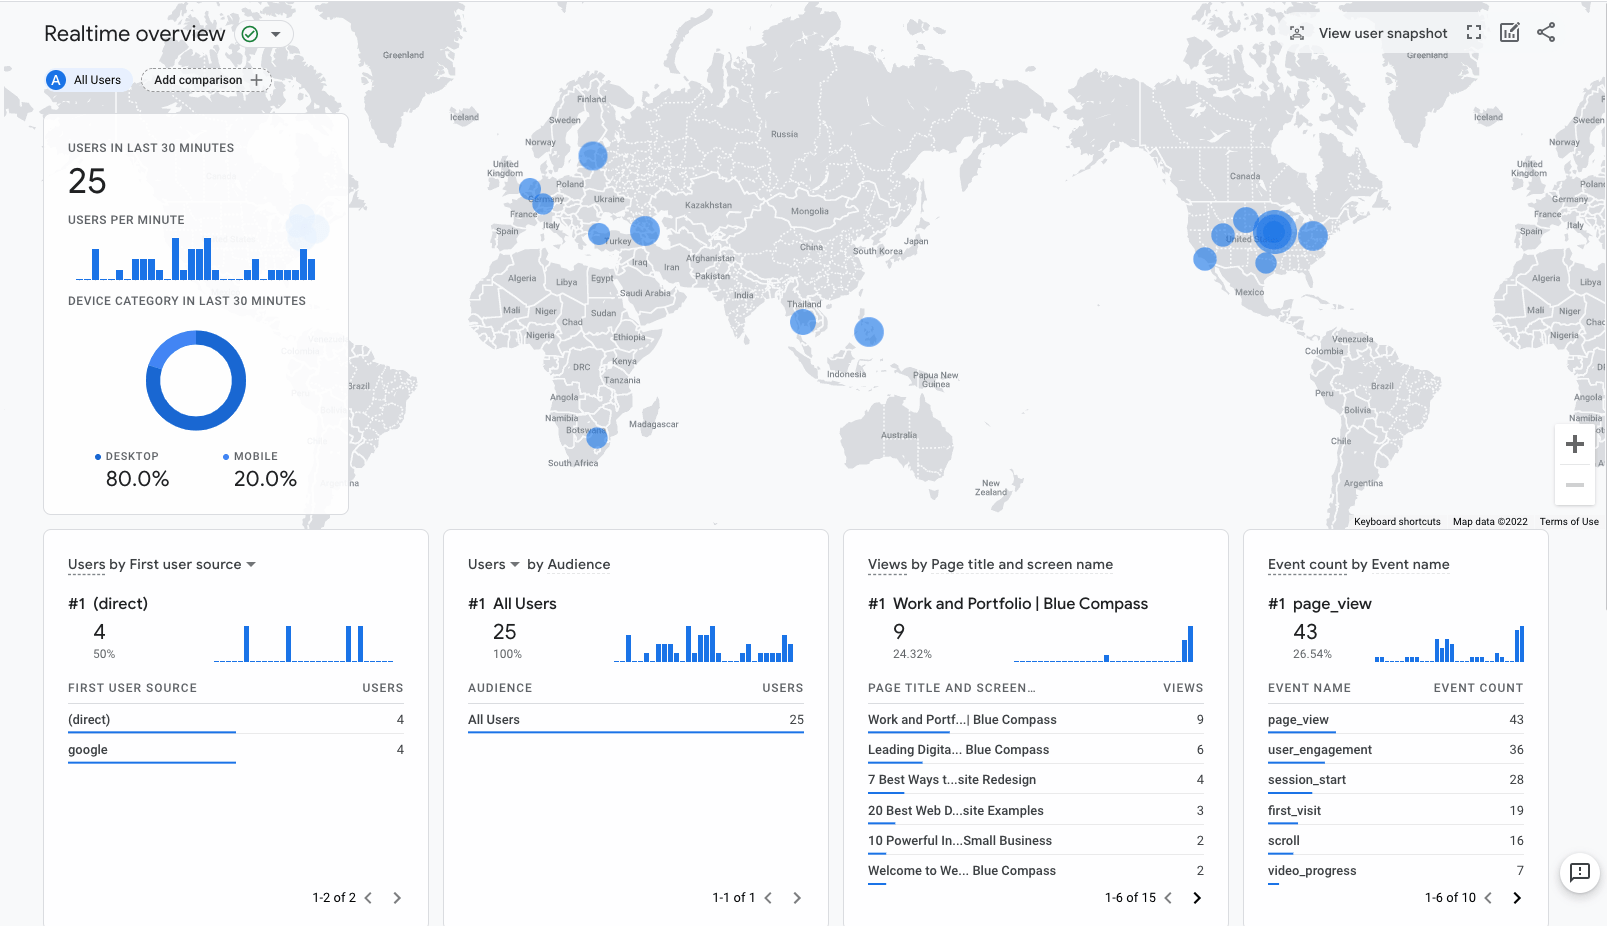
Just like in Universal Analytics, the realtime report in GA4 lets you monitor app and website activity as it happens (within the last 30 minutes). It provides the data in an easy-to-read format with supporting visuals that include information about:
- The number of users that visited your site in the last 30 minutes.
- Where they are coming from.
- Who your users and audience are.
- What content they’re engaging with on your site.
- Which type of events they trigger and which conversions they complete.
Both UA and GA4 provide real-time reporting. However, GA4s came with some improvements, one of which is a major facelift. In GA4, you will have access to much more interactive visuals, which you can use to dive deeper into certain widgets like event triggers. GA4 also provides an immediate snapshot of this data using cards. You can use these cards to navigate data from one main viewpoint easily.

User Snapshot Feature In Realtime GA4 Report
The user snapshot feature can be extremely useful for quickly viewing information about a single user’s device, app version, location, top events the user triggered, and relevant user properties. Accessing the user snapshot is extremely easy, even for brand new users. All you have to do is click View user snapshot at the top of the realtime report. You can then switch between and view data about other users with the arrows in the first card at the top of the report.
Google Analytics 4 Custom Reports
Universal Analytics came with 78 standard reports out-of-the-box. Google Analytics 4 cuts that down to 19. A main concern from analysts was losing the reports they’ve become so familiar with and fond of. Another would be the loss of valuable data. Keep in mind there were many significant improvements made that allowed this drastic reduction possible. These improvements have given marketers increased customization capabilities, reporting cards and the Explore custom reports builder to supplement missing reports or create entirely new ones.
Create A Custom Report In Google Analytics
Before you can begin creating Google Analytics 4 custom reports, you’ll need to have Editor access within the property. Each property can have up to 200 custom reports that allow you to make up for the significant change in reporting from UA and view data in GA4 the way you did in UA. These reports can easily be saved for later access, or even shared with others through the three simple steps:
- Click in the top right of the report.
- Click Share Link.
- Click Copy.
Learn More About GA4 Reports With Blue Compass
Our team members are always keeping up with the latest marketing trends, and we’re monitoring any announcements and changes to Google’s newest tool. If you still feel lost about Google Analytics 4 reporting, don’t hesitate to get in touch with one of our team members. You can contact Blue Compass today through email or text and we’ll be in touch to learn more about what you’re hoping to get out of GA4 reports. Or, you can speak to a digital marketing expert directly by calling us at (515) 868-0010.
Contact Us Today