How Google Analytics 4 Is Different And Why Marketers Should Upgrade
Google’s newest tool, Google Analytics 4 (GA4), has an ambitious objective to replace older versions, but it will also be a drastic change in the approach marketers take to collect and report on data. Since its launch in October 2020, Google Analytics 4 has received mixed reviews from fellow marketers. For some, GA4 represents a necessary step away from broad, counting number KPIs and towards more meaningful metrics that help marketers better identify and understand their best and most important user audiences. Others see GA4 as a poor over-simplification of multiple reporting tools that isn’t more exceptional than any of them in their own right.
As it stands today, both opinions are correct, but let’s move past the debates and frustrations and take a closer look at Google Analytics 4. Throughout this blog, we’ll explore what GA4 is, what’s new, what’s the same and what is different from Universal Analytics. We will also give you our thoughts, opinions and recommendations along the way!
TLDR (Too Long; Didn’t Read)
- Google Analytics 4 (GA4) is an online analytics and reporting platform built with cross-functional marketing and development teams in mind.
- We recommend implementing GA4 alongside Universal Analytics (UA) so you can begin gathering data for historical analysis.
- There are many differences between GA4 and UA that are rooted in the philosophical shift toward reporting and analysis that is User and Audience focused and away from session and page focused.
- Events and Conversions have been totally overhauled in GA4 to the point where you can create and modify them within the tool.
- By default, GA4 only retains two months of data but this can be updated to 14 months. You will want to make this update when you set up your Google Analytics 4 property.
- Google Analytics 4 is still in beta so we have a lot of unanswered questions. The property is still missing features and has bugs that we’re discovering as we use it more. We’ve compiled a list of the most glaring omissions to date.
|
What Is Google Analytics 4?
Google Analytics 4 is an analytics and reporting platform marketers use to monitor user activity across their websites and applications. GA4 also has a number of secondary features that give its users the ability to track key events on the site or app, group visitors into relevant audiences and create custom reports.
GA4 also represents a philosophical shift in digital reporting and analysis. Where previous iterations of the tool were focused primarily on Sessions and Pages, Google Analytics has pivoted in the direction of a more User and Audience based approach. This strategic change has had a cascading effect on nearly every aspect of the platform, which we explore in more detail throughout this blog.
What Is Universal Analytics?
Universal Analytics (UA) has been the gold standard of website reporting and analysis since its launch in October of 2012. UA gave marketers unprecedented access to data and reports that empowered them to make faster, more strategic decisions about their site, content and marketing efforts. It also gave us the opportunity to see that data in various ways through enhanced customization features like views, filters, content groupings and more.
A lot has changed since 2012. Over time, the platform has become bloated and unwieldy for new and experienced users alike, requiring an advanced, technical skillset to get the most out of the platform.
Is Universal Analytics Going Away?
If you love Universal Analytics, have no fear because the marketing analytics giant is not going away. With that said, Google will eventually stop making updates and maintaining the platform in order to reallocate resources to Google Analytics 4 improvements. This means they won’t be introducing any new features or updates outside of bug and crash fixes.
Why Upgrade To Google Analytics 4?
It’s important to note that GA4 is not an upgrade from Universal Analytics - it is a different approach. While older versions focused solely on website metrics, the new tool puts more emphasis on the audience on your site and how users interact.

There are many reasons to add Google Analytics 4 tracking to your site, and the first one is because there is little to no risk in doing so. Setting up GA4 will not cause you to lose any data or break any connections within your other properties. The only downside to running both GA4 and UA simultaneously is it may slow your site speed down slightly as it will need to run an additional script. Our search engine optimization experts highly recommend running and checking both tools, so you can compare similar metrics between Universal Analytics and Google Analytics 4 and make sure your new setup is on track to collect the information you want.
Another good reason to implement GA4 early is so you can begin collecting data. While you are probably already using UA to capture your website information, Google Analytics 4 will utilize that data in a different way. You can start gathering valuable information so it’s available when and if you decide to make a more significant investment into GA4. Without historical data, it will be difficult to get any value out of the tool when you want to move forward with it. This will also give you time to test GA4’s new features, set up Events and Conversions and generally familiarize yourself with the platform.

If you’d like to get Google Analytics 4 implemented on your site but aren’t sure where to start, Google has put together some easy-to-follow instructions. Go through the path that matches your website or app set up and start collecting data!
Back to Top
How Is Google Analytics 4 Different From Universal Analytics?
Now that we’ve established what it and the previous generation are, let's talk about what makes Google Analytics 4 different from Universal Analytics and what similarities do they share. We’ve broken the platform down into easy-to-digest categories that are shared between the two iterations of the analytics and reporting platform. If there is a specific area you're interested in, you can jump there by using this table of contents.
Google Analytics 4 Metrics
The primary similarity between GA4 and UA is in how metrics are defined. In both platforms, metrics are the results of a user’s interaction with your site. Both also have two types of metrics: counting and calculated metrics:
Counting metrics are interactions with your site that reflect the total number of the defined interaction. An example of a counting metric that both GA4 and UA share is Users.
Calculated metrics are the result of a calculation involving two or more relevant counting metrics. An example of a calculated metric in GA4 is Engagement Rate, which is found by dividing Engaged Sessions by Sessions.
A majority of the differences between GA4 and UA ties back to the shift in philosophy. Many of the “new” metrics in GA4 are very similar to those in UA but with a semantic difference. We go into more detail on every new metric in our Google Analytics 4 Metrics blog but a great example of this semantic shift is the previously mentioned Engagement Rate metric.
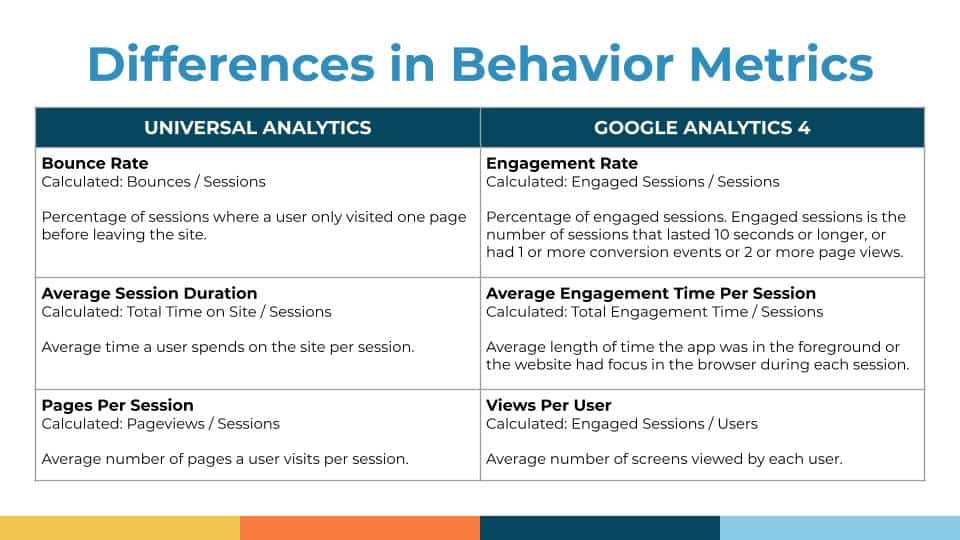
Engagement Rate, a new metric in GA4, is essentially the opposite of a popular metric in Universal Analytics: Bounce Rate. Where Bounce Rate indicates what percentage of Sessions ended after one Pageview, Engagement Rate lets you know what percentage of Sessions resulted in a desirable outcome like an Event, Conversion or long Session.
Comparable Metrics In GA4 vs Universal Analytics
We’ve compiled a list of comparable metrics between Google Analytics 4 and Universal Analytics along with their definitions.
Engagement Rate (GA4) & Bounce Rate (UA)
|
|
Engagement Rate
The percentage of Sessions where the User either spends more than 10 seconds on the site or completes an Event. It is calculated by dividing Engaged Sessions by Sessions.
Bounce Rate
The percentage of Sessions where the User only visits one page and then leaves the site. It is calculated by dividing Bounces by Sessions.
|
Avg. Engagement Time Per Session (GA4) & Avg. Session Duration (UA)
|
|
Avg. Engagement Time Per Session
Average amount of time a User is engaged with the site in a single Session. It is calculated by dividing Engagement Time by Engaged Sessions.
Avg. Session Duration
Average amount of time a user spends on the site in a single Session. It is calculated by dividing Session Duration by Sessions.
|
Page Views Per User (GA4) & Pages Per Session (UA)
|
|
Page Views Per User
Average number of pages a user visits over a given time period. It is calculated by dividing Page Views by Users.
Pages Per Session
Average number of pages a user visits in a single session. It is calculated by dividing Pageviews by Sessions.
|
New Google Analytics 4 Dimensions
Similar to metrics, the major thing that dimensions from GA4 share with UA are their purpose and definition. While metrics are the outcome of a user’s interaction with the site, dimensions are the characteristic of that user and their interactions. This symbiotic relationship between the two data points is why it’s unsurprising that their changes seem to be parallel to one another.
If you are familiar with dimensions in UA then you’ll feel right at home in GA4 as far as what dimensions you have access to. But, it may take some time to get used to the new naming conventions. While dimensions have remained mostly unchanged apart from some semantic updates, there are some new dimensions worth exploring:
One of those new dimensions is User Stickiness, which is a characteristic that is applied to Users based on how frequently they access your site. More specifically, User Stickiness let’s you know how many users access your site on a daily, weekly and/or monthly basis. It can also reveal various ratios shared between those, like % of Daily Active Users (DAU) that are also Monthly Active Users (MAU). For products and services where you want users to have a long-term relationship with your site or app, User Stickiness could be valuable to monitor on a regular basis.
If you’re still confused about User Stickiness, or any dimensions in GA4, go check out our Google Analytics 4 Dimensions blog where we do a deep dive on the definition and valuable applications for each.
Back to Top
Google Analytics 4 Events & Conversions
Events and conversions are still just as valuable and customizable in GA4 as they were in Universal Analytics. They also still represent the most important interactions a user can have with your site in their own separate way.
Events encompass key ways that a user can engage with your site that doesn’t result in a desired business outcome, like a click, video view or search.
Conversions are simply events that represent a valuable business interaction, like a form fill or phone call.
While the importance and definition of both events and conversions remain largely unchanged in GA4, the way they are created has been totally revamped. Google Analytics 4 actually generates a set of events and conversions for you when you set up a new Data Stream. These include things that would have previously required Google Tag Manager (GTM) and potentially the coding expertise of a developer.
GA4 has also given marketers the ability to create new events from within the tool or modify existing ones with similar results. This new approach empowers marketers to act more quickly, allowing them to begin tracking a new interaction on the website without the hassle of waiting for a developer to implement changes. But, this new feature does come with its limitations.
Standard Google Analytics 4 users are allotted 50 custom events and 50 modified events. While that may seem like a lot, those slots can fill up quickly without a strategic tracking plan in place. Be sure to have discussions around what you want to track and why, early and often.
Do I Still Need Google Tag Manager?
Yes. While Google Analytics 4 has made adding events and conversions much easier, in most cases, it still has its limitations. You will still need Google Tag Manager for things like adding conversion pixels, custom tags and even implementing GA4, depending on your current setup. Custom and modified events and conversions are still in their infancy as well, so there may be some events and conversions that will also need to be created within GTM until those improvements are made.
Back to Top
Google Analytics 4 Reports
Universal Analytics was a revolutionary leap forward in website reporting, and Google Analytics 4 hopes to make a similar impact. One thing these two platforms share is digestible data through visualizations and relevant metric and dimension groupings. The ability to easily find and analyze data from your site is what makes these tools valuable because they can be presented and explained to other stakeholders without them needing much prior knowledge.
However, there are some major differences between the reports in UA and GA4. While Universal Analytics made huge improvements in the area of data visualizations, Google Analytics 4 takes it to a whole other level with a cleaner look, default report customizations and a more robust, custom report visualization builder. Let’s take a deeper look at how different reporting is in GA4.
Streamlined Default Reports
Universal Analytics came with 78 standard reports out-of-the-box. Google Analytics 4 cuts that down to 19. Many improvements made this drastic reduction possible without feeling like you're missing out. Marketers using GA4 now have increased customization, a la carte reporting cards and the Explore custom reports builder to supplement missing reports or create entirely new ones.
Increased Report Customization
If you weren't super excited about losing a few reports, have no fear because GA4 features a whole new way of interacting with and editing your reports so you collect the data you need by default. If you get to a report and don’t see a metric or dimension you’re looking for you can simply add it!
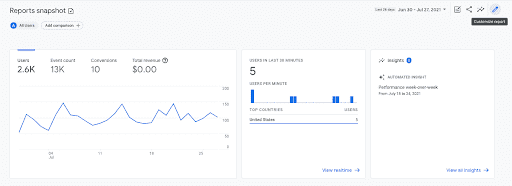
Every default report in Google Analytics 4 has a small pencil icon on the top-right hand portion of your screen, below your profile image. Once clicked, it will open a new window where you can edit the displayed metrics, dimensions, chart types and summary cards to meet your needs. You can also change what dimension is set as the default. When you have everything the way you’d like it, you simply click the Save button and then choose whether to Save the changes to your default report or as a new report entirely.
This level of control was not possible in UA unless you decided to build custom reports within Universal Analytics or in a separate visualization tool like Google Data Studio.
Prebuilt Reporting Cards
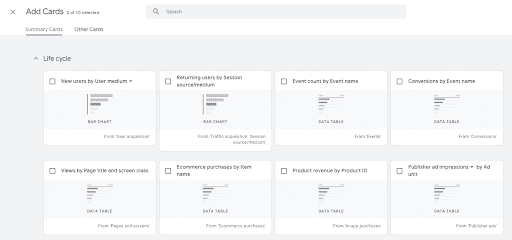
Another key innovation is Cards, which allows GA4 to walk the line between retaining a clean, uncluttered dashboard while still providing helpful visuals that showcase what’s happening on your website. Cards are modular graphical elements that can be inserted into any graph to quickly visualize the relationship between dimensions and metrics.

For overview reporting pages, GA4 supplies you with a library of prebuilt cards to choose from while the other reports allow you to quickly create your own and implement them into the report in the same way you would with other default report customizations.
Explore Custom Report Builder
If you still feel like you’re missing some of your reports from UA, that’s okay because GA4 features a brand new report builder called Explore. Explore allows you to create non-standard reports and/or more complex visualizations.

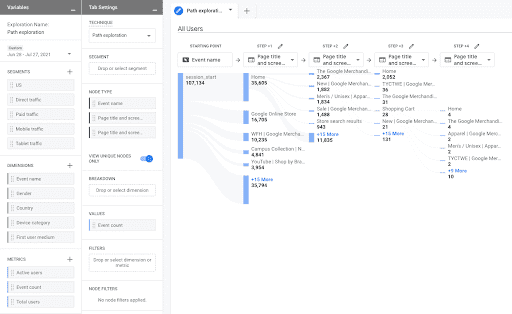
For example, a report we would reference often in Universal Analytics is Behavior Flow because it visualizes how users are navigating the site in an intuitive way. This is not a standard report within GA4, but you can add it with Explore in 4 clicks: First click Explore, click the Path Exploration template in the gallery at the top, click the dropdown below “Step +1” and then change it to one of the Page Title options.
Realtime User Snapshots
While the Realtime Report got a visual overhaul, it also received a valuable new feature: Realtime User Snapshot. This tool allows you to watch how an anonymous, individual user is using your site as it happens. You’re able to see some basic information about the user but the real value is in watching them interact with various elements of your site.
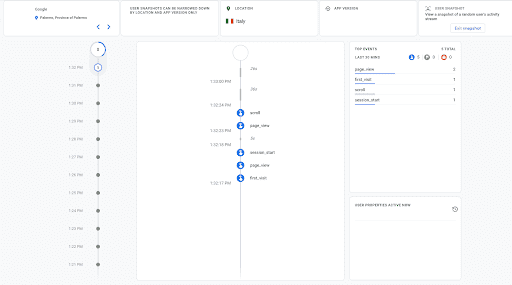
Seeing data at scale can be helpful but sometimes it is more impactful to watch an unbiased individual make decisions on your site and compare it to how you would expect and/or like them to carry out those same actions.
Back to Top
Google Analytics 4 Views, Filters & Settings
View, filters and settings, in general, are perhaps the most different grouping of features in GA4 when compared to Universal Analytics. This is maybe best illustrated by the fact that Views no longer exist, filters are much more limited and settings have been largely automated or simplified. One of the only carryovers from UA is the fact that all of your settings and administrative functions can be carried out from one location - the Admin navigation. Having all settings still within one centralized hub is very helpful when making changes both large and small. Let’s take a deeper look at how the changes have impacted each aspect.
Views
At Blue Compass, setting up standard views is part of our routine process of setting up or cleaning a Universal Analytics property. These views allow us to see the data at different levels of filtration and run tests without compromising data integrity. There’s no easy way of saying this but… views are gone in GA4 along with many other settings and filters that we’ll cover.
There are multiple factors as to why it appears this change was made. First off, many UA properties included a raw view that was of little to no value because it included traffic from bots and internal employees which would skew your data. GA4 mitigates the need for this by dynamically filtering out known bot and spam traffic and giving you a quick, easy way to filter internal IP addresses.
Testing views were also commonplace in many UA properties. These were often used to experiment with different filters before adding them to another clean reporting view. The GA4 team saw this and decided to add a testing dimension where you could run and compare data based on unpublished filters until you formally add them to this Data Stream.
Filters
Filters were also effectively removed from Google Analytics 4. Many advanced Universal Analytics users are accustomed to being able to filter and manipulate incoming data in a myriad of ways, but GA4 did not retain this functionality. In GA4, filters are limited to internal and development traffic.
While this has been frustrating for many marketers, there is a silver lining for IT network professionals! GA4 has added CIDR notation as a match type option when trying to filter out internal traffic. For larger companies with multiple IP addresses at various locations, this new feature gives them the ability to do that more efficiently, reducing the back and forth with their marketing co-workers.
Settings
Because of Google Analytics 4’s lofty objective of bringing so many separate tools under one umbrella, they had to overhaul their settings to accommodate those changes. There are way too many updates to cover them all here, but we’ve highlighted a few need-to-know items below.
Back to Top
Data Retention
One of the hallmarks of Universal Analytics was the fact that you were able to keep all of your data from the time you implemented your tag until now. That is not the case in GA4. The default data retention timeframe in Google Analytics 4 is only 2 months but can be increased to 14 months. You can do this by navigating to Admin menu → Data Settings → Data Retention and then update the dropdown.
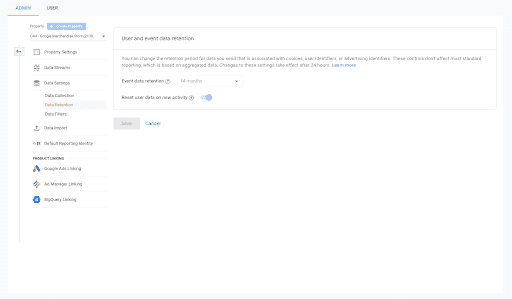
We would strongly recommend making this update if you leverage historical data for things like year-over-year reporting.
Data Streams
One of the big innovations in Google Analytics 4 is the ability to compile data from each version of your site including apps. They’ve achieved this through Data Streams. These work very similarly to a Property in UA except they are able to be implemented in apps and their data can be aggregated together. Data Streams will also be your hub for any high-level setting changes like site search, cross domain tracking, defining internal traffic and session timeout and engaged session adjustments.
Attribution Settings
Google has been making a big push to move away from last click attribution and toward a more scientific model like linear attribution. This shift has been reflected in other Google products and services like Google Ads. Within the Attribution Settings page you have the ability to not only change your attribution model but also fine tune your conversion windows based on your preferences.
Before making any changes to the default attribution model or conversion windows, you should take the time to research each option and discuss with your team what works best for your products, services and/or organization. Any adjustments you make in the attribution settings page have a large scale impact on the rest of your data, so you want to be careful and make sure you get it right.
Back to Top
What Are Google Analytics 4 Limitations & Missing Features?
It’s important to remember that Google Analytics 4 is still in beta, so some things are still in the works. There have been a lot of major changes as marketers start to dive in, and we hope there are more updates coming that will fill some gaps we’re currently seeing within the platform. While GA4 represents a big step forward for marketing analytics and reporting in many regards, it is still missing some core functionality we’ve become accustomed to in UA. Some of the omitted features appear to be more intentional while others seem like they might have fallen through the cracks. Let’s take a look at some of the major items we are still waiting on from Google Analytics 4.
Common Filter Functions
Setting up a new Google Analytics view used to consist of two major steps: dial in all of your settings and then add in your filters. The most common ones included internal IP addresses, lowercase URLs and advertising click IDs. GA4 has broken a couple of those out into their own sections like Internal and Development IP address but didn’t make a way for advanced users to make more granular filters for the others.
This is likely a conscious choice as opposed to a mistake. One of the main reasons for this approach is that GA4 has done it’s best to make many of these filters unnecessary. The advertising click IDs filter, for example, makes sure clicks and interactions from ads are credited to the desired destination page rather than the unique, auto-generated URL they create. GA4 tries to make this unnecessary by focusing on Page Title rather than Page Path (relative URL) because the Page Title is much less likely to change dynamically.
While these platform adjustments work for a majority of users, things like Page Path are still a filterable dimension in GA4 and not having the proper tools to more accurately display that data is frustrating for more advanced users. We hope to see some more control over filtering in the coming months.
Common Date Range Parameters
Most marketing teams and businesses report on a monthly or quarterly basis. Those same teams and organizations also often review data on a month-to-date or quarter-to-date basis, but you will not find any date range filtering capabilities for month or quarter in Google Analytics 4. In order to compare last month’s data to the previous month, you will need to use the custom date range widget for both the current and previous month.
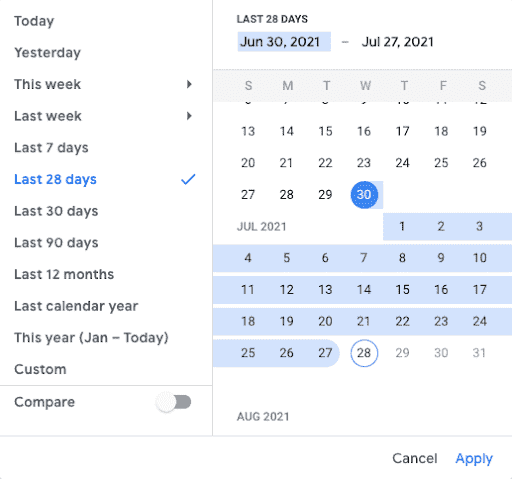
While this isn’t a huge technical omission on Google’s part, it will be a big time waste for teams investing heavily in reporting with any regularity. Ideally, the GA4 team will either add in date range presets for things like Last Month, Last Quarter, This Month and This Quarter or allow users to build their own presets and make them defaults.
Search Console Integration
Google Analytics 4 currently has native integrations for Google Ads, Ads Manager and BigQuery but has not created a data link to their other popular website reporting and maintenance platform, Google Search Console. Feeding this data into your Universal Analytics account provides immense value because it allows you to not only look at what search queries were driving traffic to your site but also which ones were driving more engaged Users.
Since Search Console is a part of Google, we anticipate that this will be a fairly quick addition to GA4 but we’ll have to wait and see.
Upgrade To Google Analytics 4 And Start Collecting New Website Data
Feeling a little overwhelmed? Still not sure where to start with GA4? Don’t worry, Blue Compass' SEO team is here to help! Our team members are always keeping up with the latest marketing trends, and we’re monitoring any announcements and changes to Google’s newest tool. So come back to this blog for updated information as more news is released. Contact Blue Compass and a member of our team will be in touch to learn more about what you’re hoping to get out of Google Analytics 4.
Contact Us Today